PRODUCT DESIGN
Visualising big data
MY ROLE
I led the UX for Apple business intelligence for Retail. I collaborated with data engineers to define the metrics for retail. My goal was to enable analysts and executives to take data driven decisions.
PROBLEM
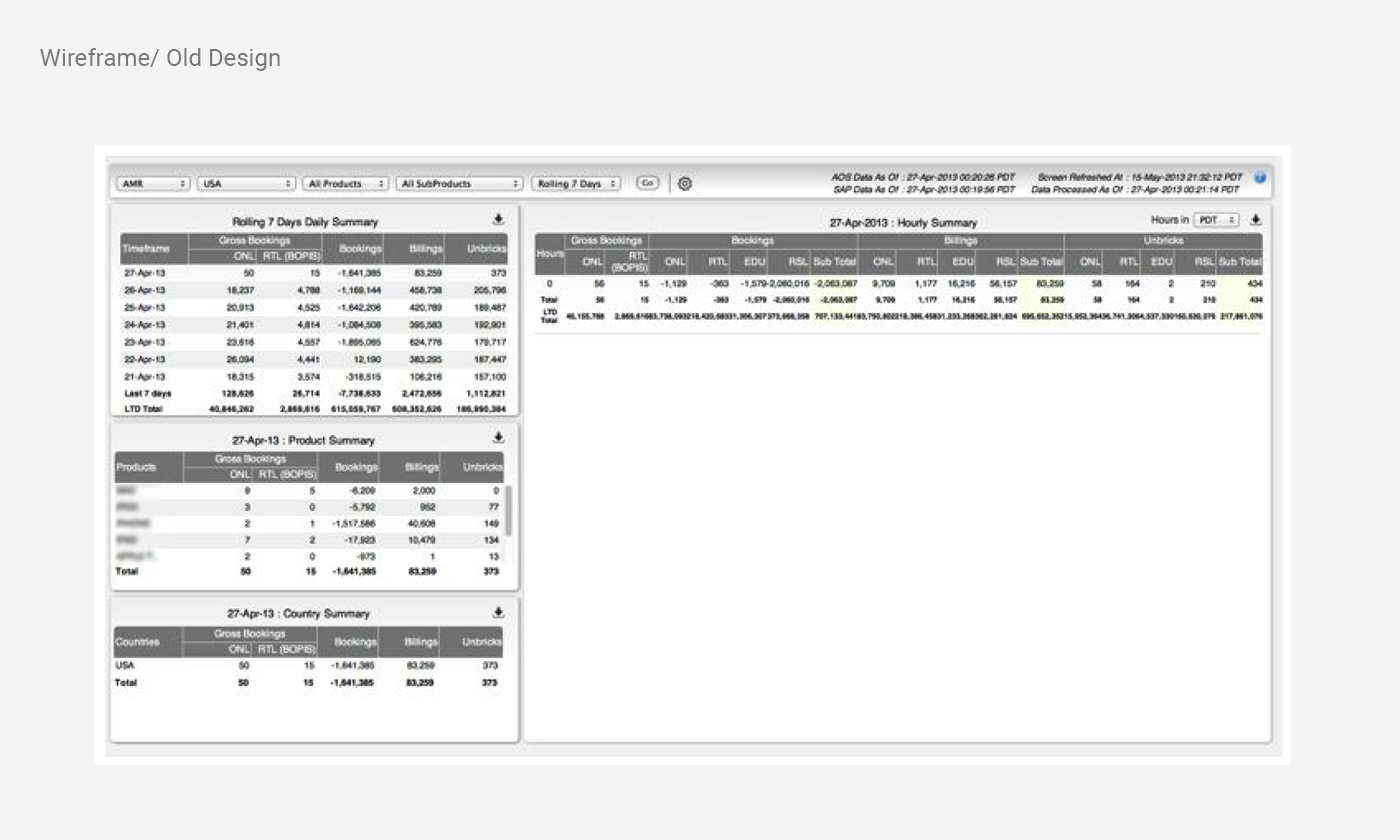
The purpose of Apple retail stores is not just seeling products but also build relationship with customers. BI team is building a central system to gather and display relevant insights for Retail. Existing data is on spreadsheets, it does not have dashboards to show the overall health of the business or have customized access to different users.
The purpose of Apple retail stores is not just seeling products but also build relationship with customers. BI team is building a central system to gather and display relevant insights for Retail. Existing data is on spreadsheets, it does not have dashboards to show the overall health of the business or have customized access to different users.

DESIGN APPROACH
I was new to data visualization, so I took an iterative approach.
PHASE 1: MVP
I was new to data visualization, so I took an iterative approach.
PHASE 1: MVP
- I started with a bare minimum template design for dashboard
- Basic design language with consistent colors, typography and layout
- Pulled content from spreadsheets into responsive dashboards

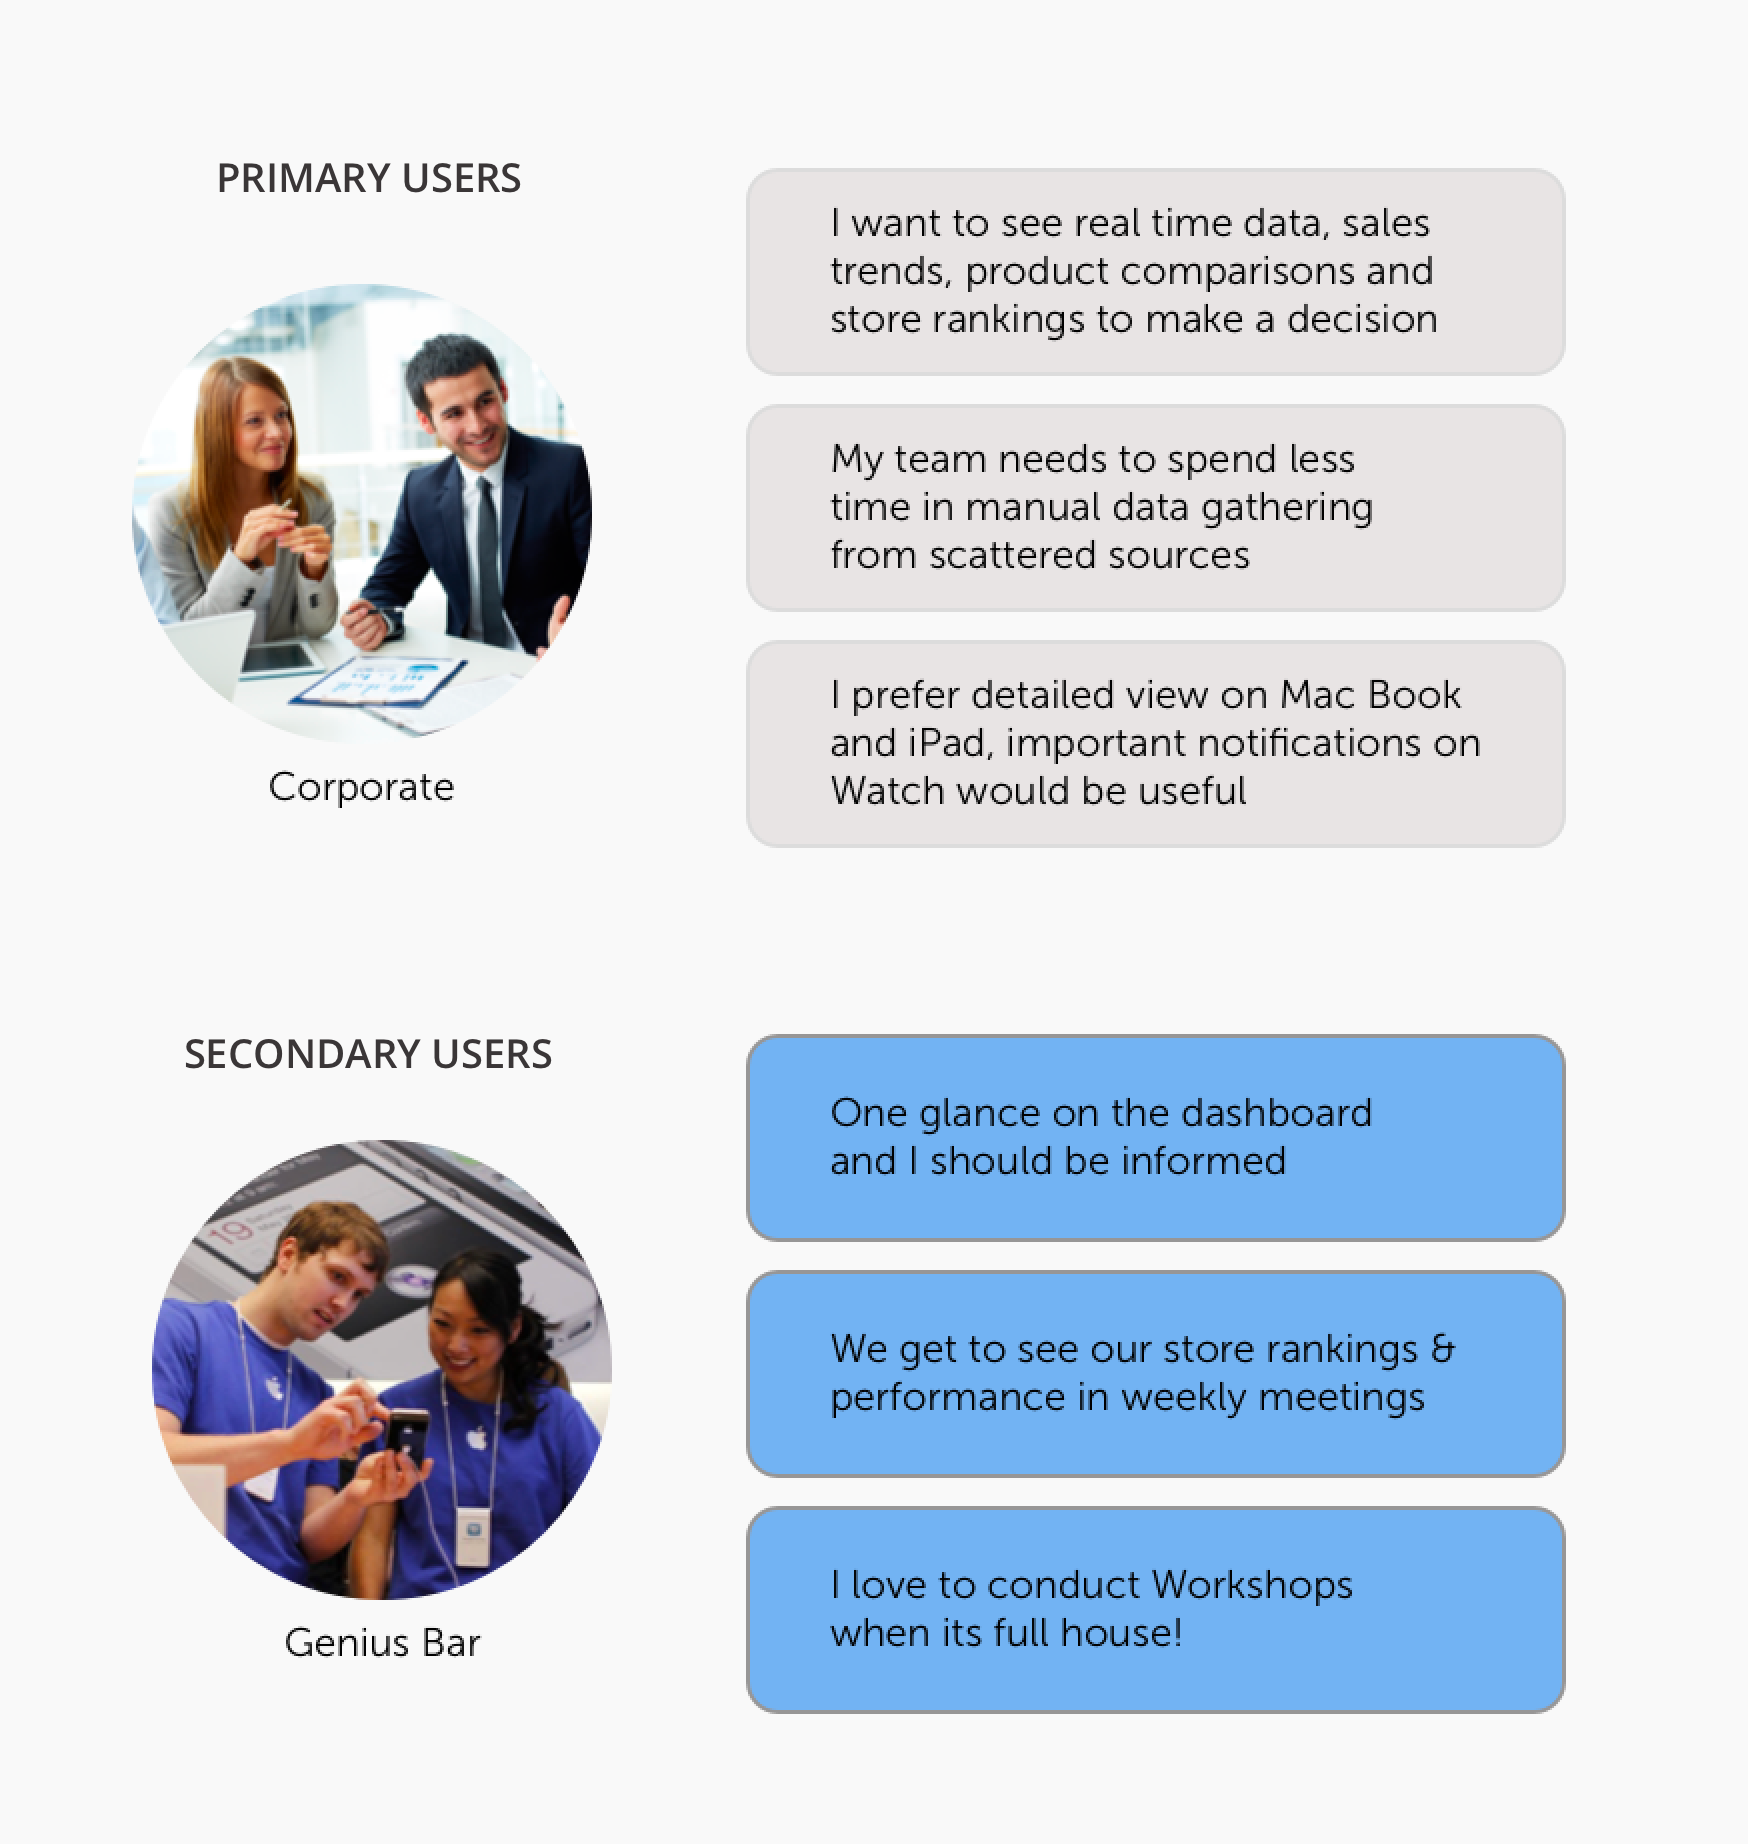
PHASE 2: Gather insights
- I conducted workshops and 1:1 interviews with retail executives to understand the key drivers, primary and secondary users and set clear context for the dashboards
- Conceptualize, prototype and test with users
- Iterate and get buyins from stakeholders
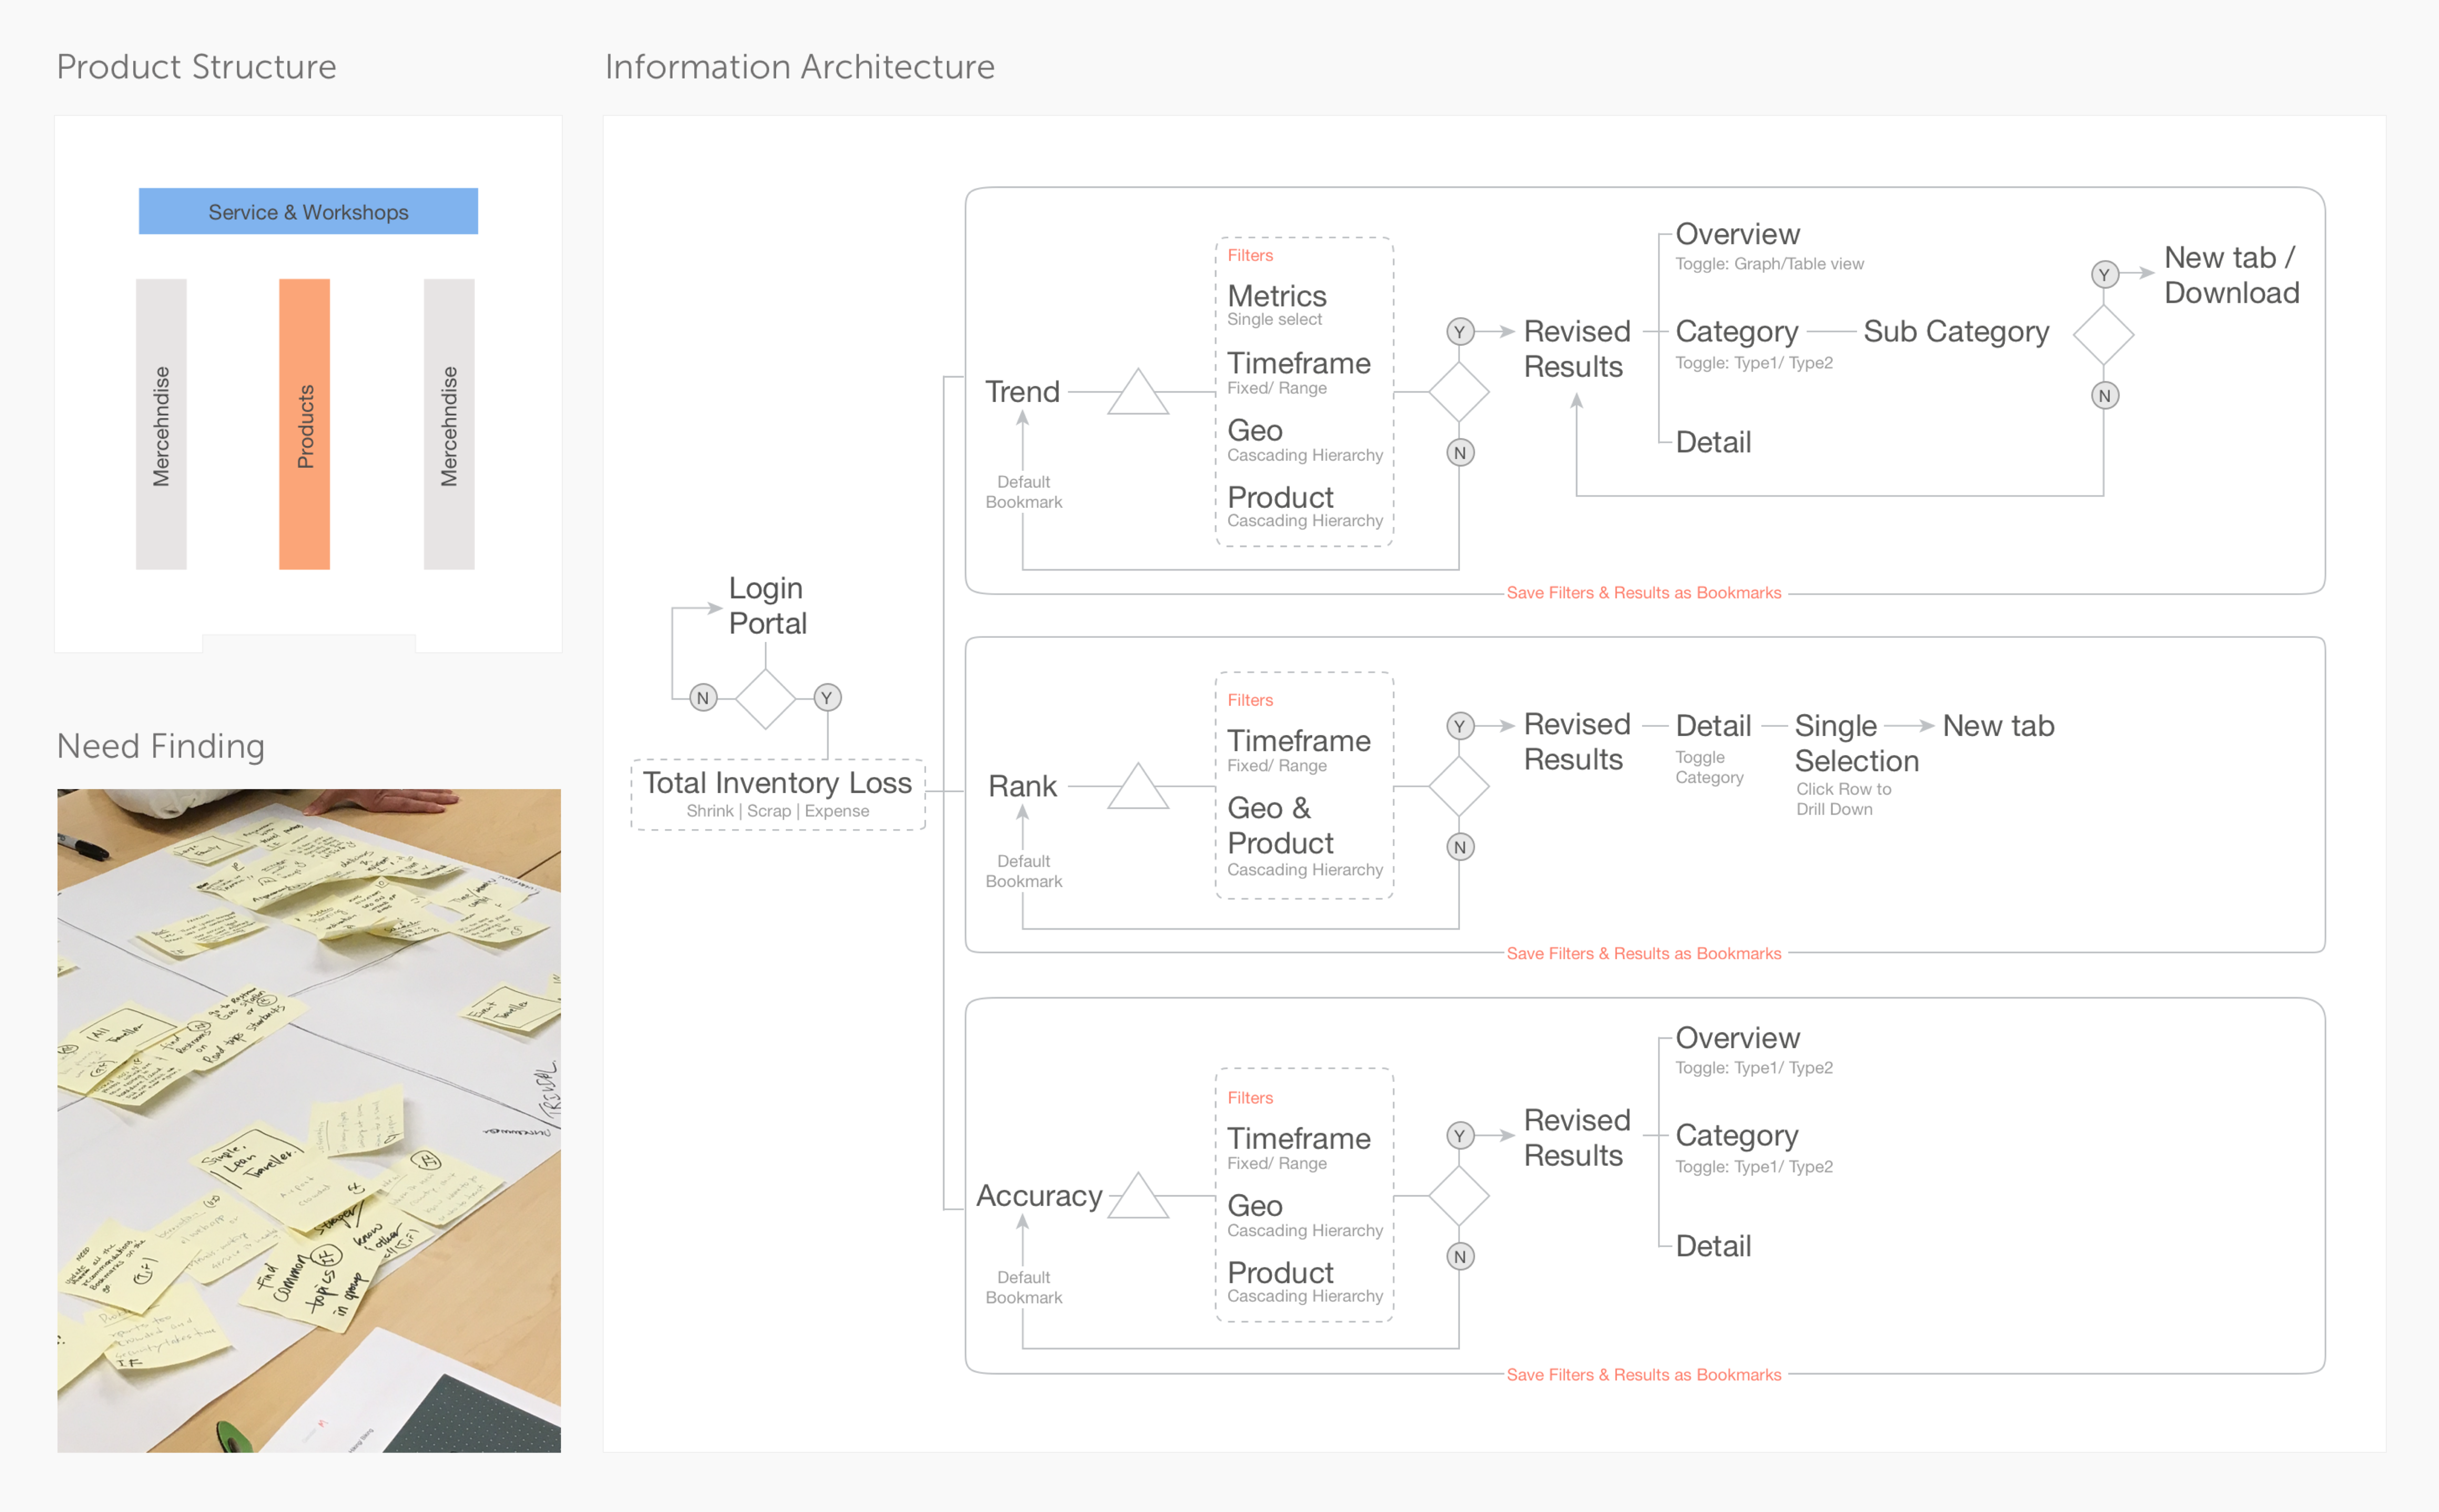
PHASE 3: Scalable framework
- Design tenets for storytelling with data visualization
- Setting up a design process that will understand the requirement and recommend an optimal dashboard design
- Repository of data vizualizations and diagrams

SUCCESS
User experience played an important role in improving
User experience played an important role in improving
- Turn around time
- Reduced training costs
- Higher adoption rate
- Higher customer satisfaction
Work done at Apple through Cognizant , 2016
Disclaimer, text and numbers used in the artwork are placeholder and not the actual data.